MTCG is responsible for the production of the data programs for transit service and ridership demand for over 200 routes across Puerto Rico. With our robust data collection capabilities, MTCG has been able to document year-by-year and for every season how transit riders and services are adjusting (either through growth or decline).
Our dedicated staff of statisticians and developers are constantly unlocking ways to add value to new data and to legacy data. In recent years, mobile GIS technologies have introduced new layer of spatial visualization of data which have enabled more complex business intelligence and analytics. More recently, the use of open sourced big data has allowed us to harness real-time information for decision-making processes that are more accurate.
With the introduction of data analytics in our repertoire of services, we can unlock hidden value for our customers, as this case study shows.
Case Study 1: A significant impact to public transportation
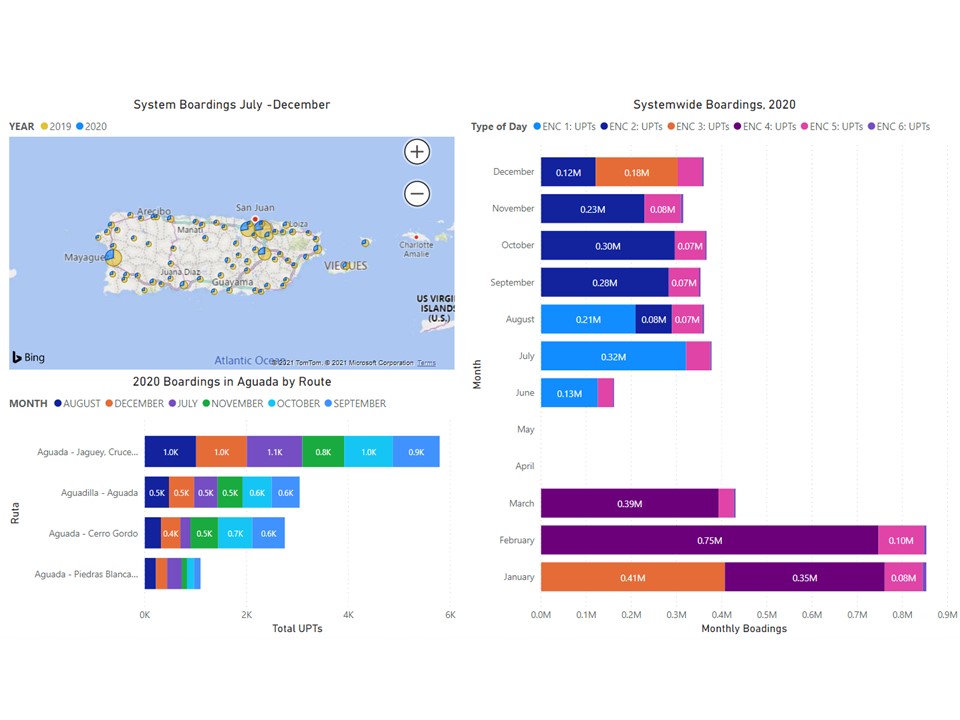
2020 was a year like no other. Public transit was one of the hardest hit industries during this year. A 6.4 earthquake on the early hours of January 7, followed by weeks and months of continuous seismic sequences on the southern municipalities caused significant disruption in everyday life and destruction of property and institutions. Public transportation facilities were destroyed or rendered structurally unsafe in Ponce, Guayanilla and Yauco. The SARS-COVID pandemic disrupted travel choices among both captive and choice riders, which was accentuated by a lockdown between March 15, 2020 and Jun 17, 2020. Even after the lockdown was lifted, the pandemic has produced changes on traveler behavior and demand for service. The second half of 2020 saw demand reductions in the range of 50 percent to 65 percent from previous levels. Similarly, service supply decreased by as much as 70 percent throughout the island. In some routes, service supply has not recovered.
The dashboard shown below highlights the changes in system boardings across Puerto Rico for the second half of 2019 and 2020, the total system boardings for 2020 and the boardings for services in Aguada between July 2020 and December 2020.
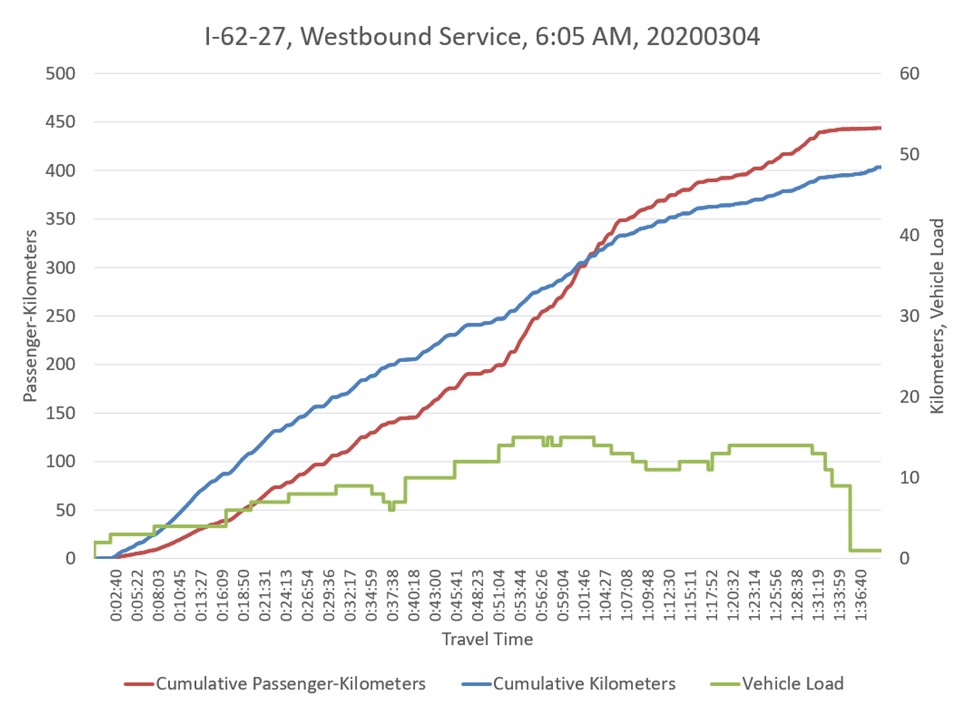
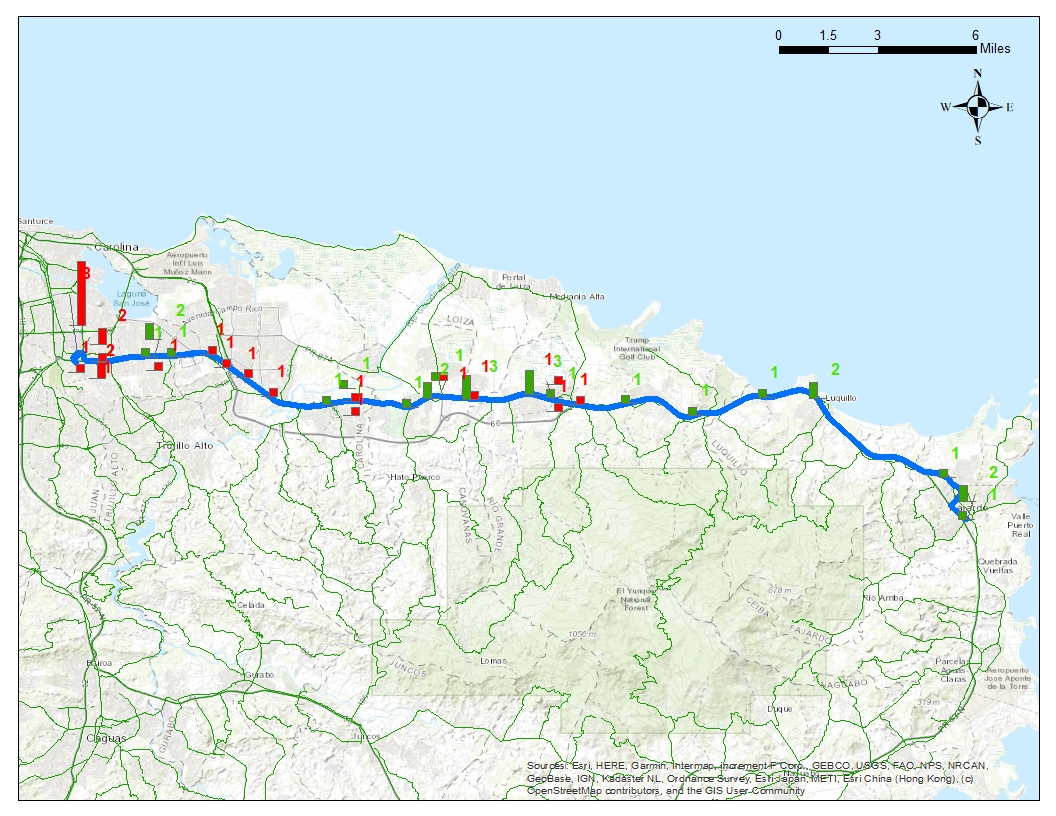
Case Study 2: Improving field data collection with georeferencing
Many demand response transit services do not rely on fixed transit stops for boarding and alighting of passengers. This presents a challenge when determining with accuracy the relationships between vehicle traveled distance, passenger traveled distance and vehicle loads. Mobile deployment of GPS units with ride-checking software allowed us to accurately determine the distances traveled by passengers and pinpoint the location of the places of transit activity. This resulted in better accuracy of passenger-kilometers (passenger-miles) traveled – a key performance metric of transit systems – and at the same time uncovered a new source of information for transportation planning purposes. The georeferencing of the ride checks also provided new information on route deviations, which are common in demand response services.